
If you’ve followed me for any length of time, you know I’m a big proponent of doing field tests to estimate your lactate threshold. I’ve done numerous metabolic tests in the past (although the last one I did was probably 7 years ago), but I’ve never had a chance to do a lactate test.
I just completed a 12-week periodized program at the Vail Athletic Club. We did a field test and FTP test using Keiser bikes at the beginning and end of the program. The first two months were mostly spent below threshold, with a couple of intervals up to threshold (a few short episodes above). The last month we spent quite a bit of time doing intervals at threshold with some short above-threshold intervals.
I’ve conducted over 25 field tests over the years with my students and at workshops and conferences, but probably only about 6–8 on myself. When I do them with students I’m usually off the bike encouraging them. However, after so many years of teaching about heart rate intensity at threshold, writing about it, researching, I think I can identify exactly what it feels like. A few years ago I wrote this blog post called Validation is so…Validating! While riding up a long climb on which I wanted to push myself but not blow up…I said this in that article:
In short, this validated what I’ve known for many years—that I can pinpoint my threshold heart rate at right around 159, give or take a beat or two. It has consistently been this number for the past 6–8 years (my last VO2 max test was about 6 years ago, and it was 158 at that time). It is usually closer to 157 in the winter when I’m not as aerobically fit, and closer to 161 when I’ve been in my best shape.
Well, these are the results of my lactate test last week:
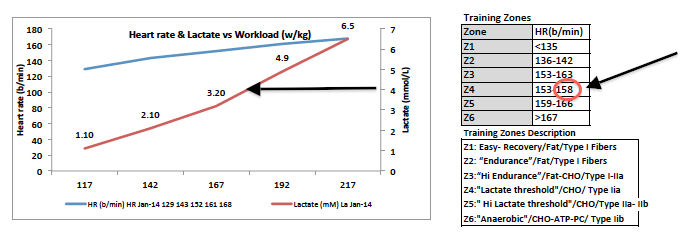
My lactate threshold, where I reached approximately 4 mmoles of lactate per ml, was a heart rate of 158.
Bingo!
In the past 7 years I’ve only ever tested that through subjective tests, and I was spot on.
Hey..this stuff works!
Have you learned how to do the Talk Test and a Field Test? Estimating LT heart rate is an essential component of establishing personalized training zones, and is a very important part of what we teach you how to do here at ICA. It’s also explained in detail in the two-part webinar Mastering the Art and Science of Heart Rate Training workshop on the Indoor Cycling Summit.
I won’t reveal the rest of my test to you…yet! I have some work to do in my fitness (my power was low, but then again, on the Keiser bikes, you can’t be too accurate. Every bike is different and can only ever be compared to the same bike). (Warning…lots of excuse about to be revealed!) I’ve spent entirely too much time sitting at my computer the past 6 months and too little time on a bike or other cardiovascular activity, but that’s the sob story of an online entrepreneur…I know, that’s a poor excuse and I plan on changing it in the coming months! And when I do (especially when I do a lactate retest), I’ll let you know the results. 😉
The very exciting news is that 100% of my students who did the before and after lactate test saw an improvement in their lactate clearance, and most of them in their LTHR. Several of them did not see an improvement in the LTHR after the 12-week program, however, the lactate tests clearly showed an improvement in lactate clearance at lower intensities, which indicated improved aerobic metabolism and an improved aerobic base. They also showed improved power at threshold. Without power meters, this would not be evident; and in fact, they might have been disappointed in the program since their LTHR did not increase. This should provide evidence to those of you who do field tests without power: do not be dismayed if LTHR does not improve in one short 12-week program! There are other great metabolic improvements that might be taking place; they just aren’t very visible quite yet.
And as most of you should know, there are so many things that may affect heart rate on any given day. I live in a ski area, and many of my students were out skiing heavily the day before our first lactate test. Hey…it was a powder day, which means shin-deep light powder snow…and here in the mountains, we LIVE for powder days! What that meant is that despite my warnings to be well-rested, they were physically fatigued when they arrived for the first test. It skews the results for the rest of the program!
But here is a feel-good story of success for one of my students, and the dramatic results will hopefully reveal to you the great benefits of Zone 2 training during the base-building months.
Stirling is a young, powerful cyclist with some big cycling goals this summer. Check out his improvement:
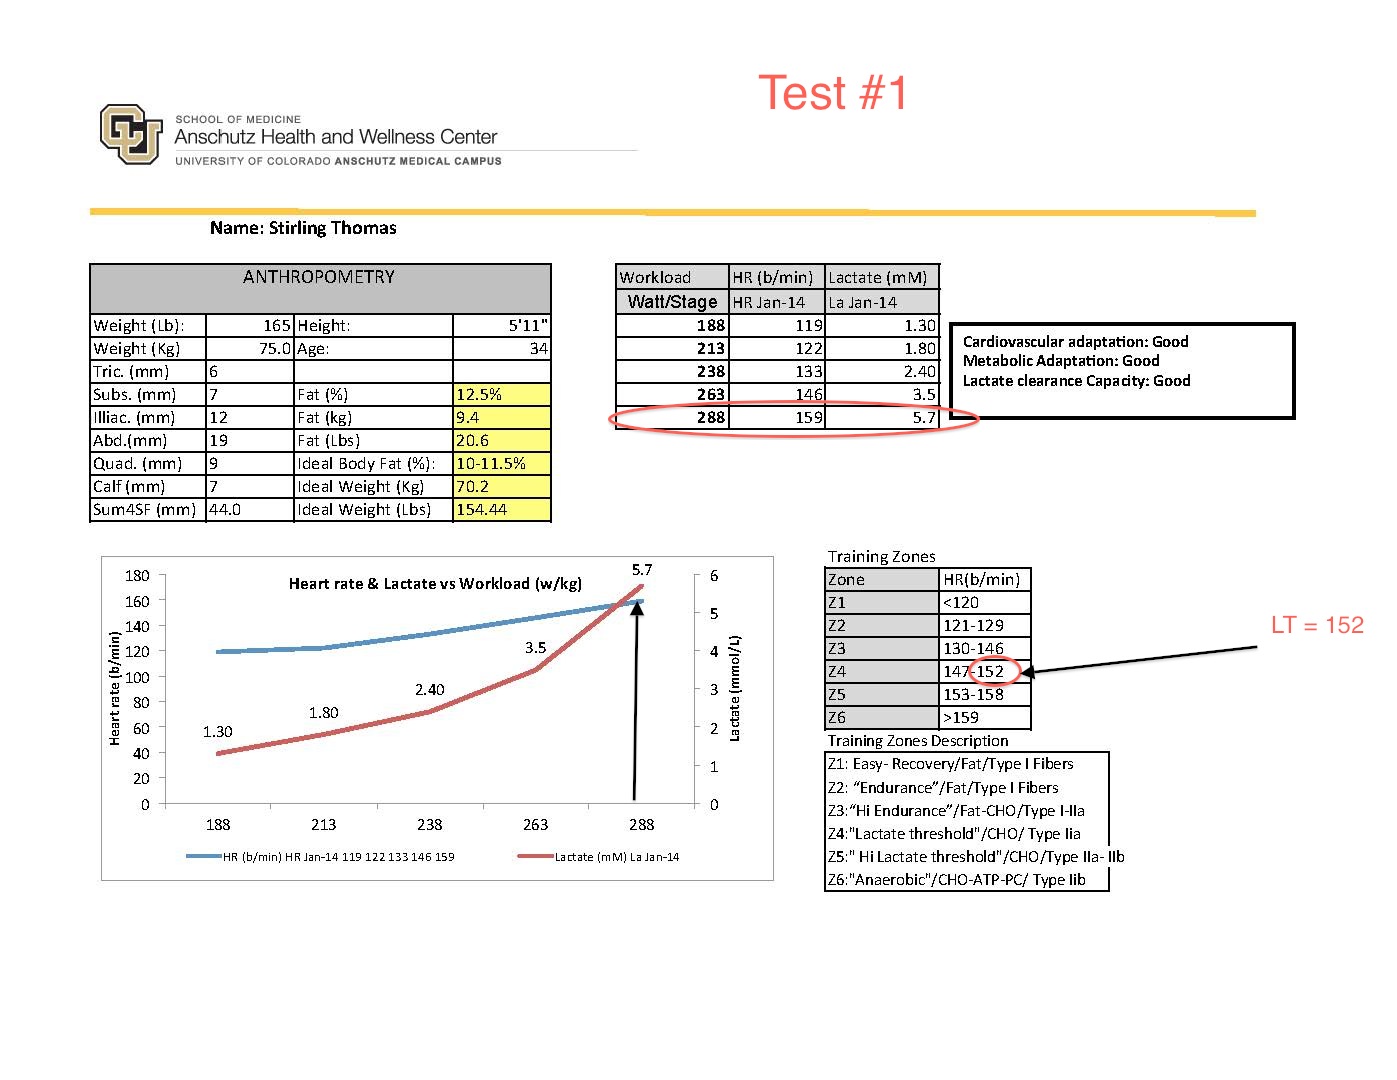
First test January 2014:
Note that his LT is 152 (top of Zone 4). This is determined where lactate equals approximately 4 mmoles/ml. As you should know by now, lactate threshold is a hard level, with very deep breathing and some discomfort in the legs, but it is still sustainable. You don’t like it here, but you can hang on at this intensity with motivation (depending on your fitness) for up to 20 minutes or more (up to an hour for elite athletes).
Note the numbers in the chart at the top right. The three columns are workload (# of watts), HR, and Lactate. Note that when his lactate is 3.5 mmoles (the 4th stage of the assessment), his power is 263 watts. He was working hard, but still in control. The next stage of only a 25 watt increase, took him well over his threshold. Lactate soared to 5.7 mmoles, and his heart rate was 159. So somewhere below that was his threshold, determined by the lab analysis to be 152 (see the red circle in the lower training zone column). These were the heart rate training zones he used for the next 3 months of training.
Test #2 took place on April 17, 2014.
It was an amazing difference!
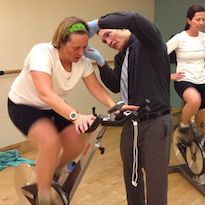
First, in the heart rate training zone column, notice that his LTHR is now 161 (top of Zone 4), almost 10 beats higher than before. Mind you, this is not a subjective assessment, this is a lactate test! As Nick Edwards says, lactate doesn’t lie! Nick, who has a master’s degree in exercise physiology, is our tester from the University of Colorado Anschutz Medical Center and Performance Testing Center. Those who watched Nick’s session on the Indoor Cycling Summit on lactate clearance and overtraining will recognize him for his passion on this subject! (That’s him doing a pin prick to measure lactate from the earlobe of one of my students in the photo at the top left.)
Now, notice the top right column. You’ll see that Stirling went 7 stages this time, instead of the 5 stages he went in January. Nick keeps them going until he has enough data to determine lactate threshold. (Stage 6 might have been enough, but he went one more just to be sure, kind of like I suggest you go “past the exit” on your talk tests.) He started him at the same level of 188 watts (based on watts/kg) and increased 25 watts per stage.
The lab analysis determined LT to be at a heart rate of 161, but what is most surprising is to notice his power output at each level. In the above test #1, when he was at a power output of 288 watts, Stirling was very anaerobic (lactate well above 4 mmoles, at 5.7. You can see the long red oval in the top chart of the image above).
Now look at test #2 below. When Stirling was at 288 watts, his lactate was only 2.1 mmoles! This is well below LTHR, meaning at the same wattage that made him completely breathless only 2.5 months previous, he was now able to talk comfortably. Now, he can ride up to 313 watts before he reaches his threshold.
Can you see how this can translate to increased performance for athletes? And can you see how for our non-athletes, this increase in LT can translate to an increase range of heart beats before they switch from fat as a predominant fuel source to carbohydrate, indicating decreased efficiency and a quicker time to fatigue?
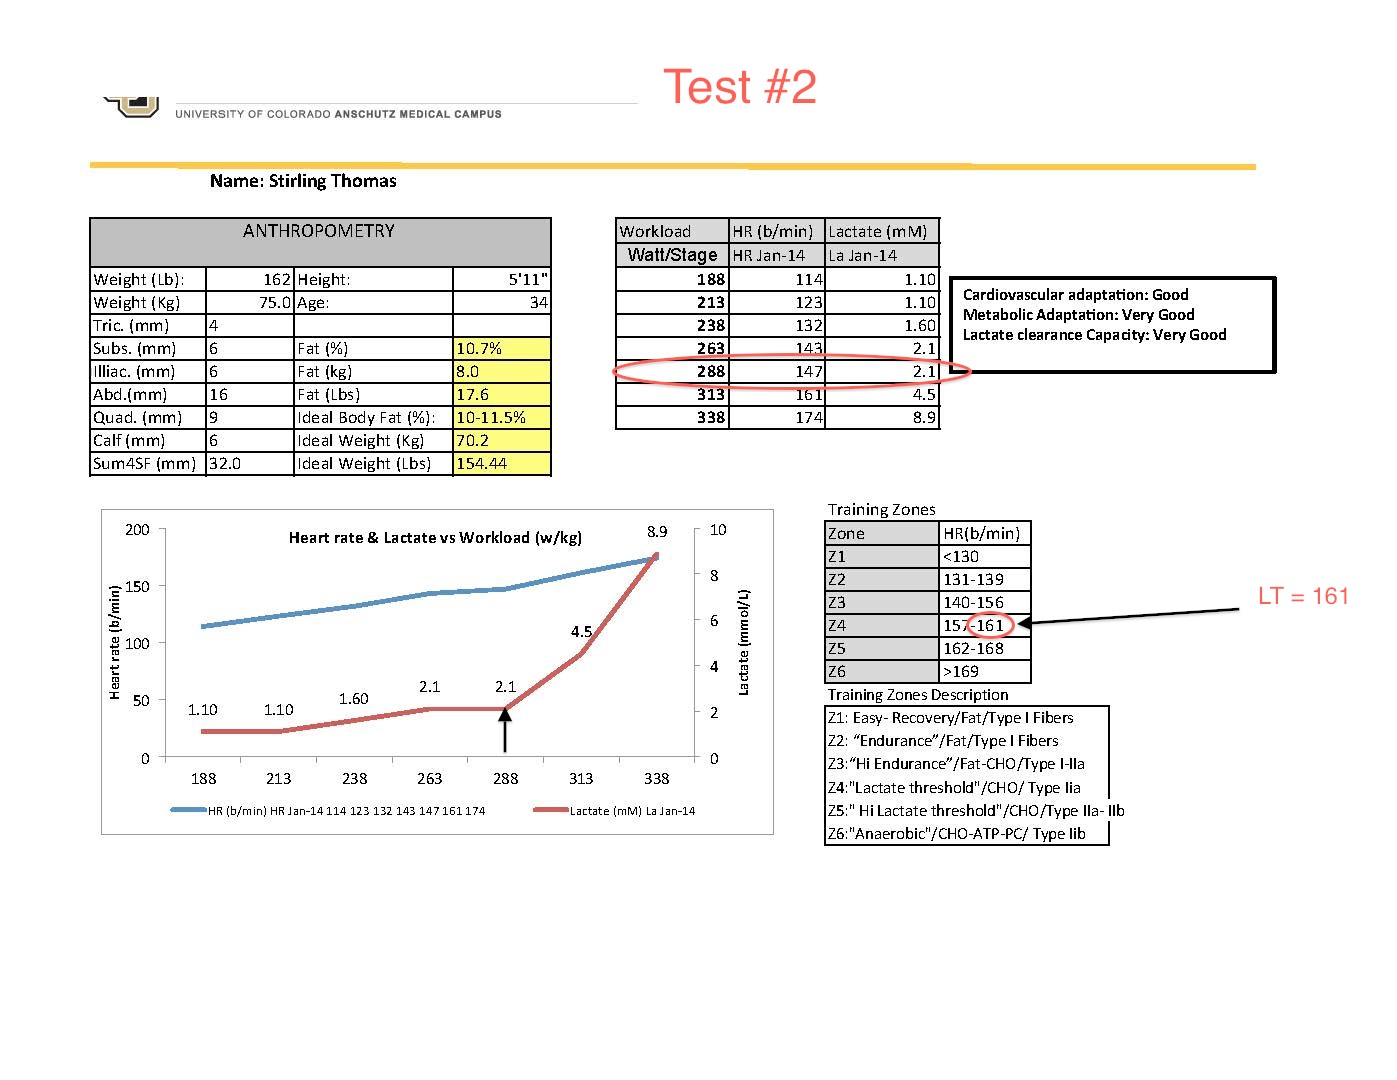
Stirling still has some work to do. Most of his improvement in his lactate clearance took place in the lower zones (although as we noted, he did raise his LTHR and increase power at threshold). But if you look at the graph in the bottom left, the red line indicates lactate. He is able to clear it quite well, until it rises steeply right at around 290 watts. That is where Stirling needs to do some work. (He’s promised to come back to my program next year; it will be fun to compare his results then!)
I hope that this demonstration shows you the beauty of aerobic training. If you can’t afford a lactate test (ours were a “special rate” of only $100 per test), you can still trust the process if you stick to aerobic training. HIIT is good, and you still want to incorporate higher intensity efforts into your program, but it is the beauty of aerobic training that elicits such amazing results in metabolic fitness. If Stirling did not slow down and spend quality time in his lower Zones 2 and 3, he would NOT have seen such dramatic results in his lactate test.
Nick Edwards and his famous boss, Dr. Inigo San Millan, work with many professional athletes, including several pro cycling teams. We are privileged to have Nick at our disposal at the Vail Vitality Center at the Vail Athletic Club where I lead these cycling clinics.
We didn’t discuss the weight. He’s quite thin, but to be an elite rider those few extra pounds dropped would definitely raise his watts/kg (and he’d look more like the scrawny pro cyclist). But it would be a trade off.
Thanks for this real world story. I will definitely use it to back up my discussions about LTHR. BTW, I stuck to my guns this year more than ever before and had my public classes in Zone 2 for weeks this winter. The results? Double digit increases in LTHR from field tests performed in January and early April. People couldn’t wipe the smiles off their faces.
What were Stirling’s reactions to the suggested ideal weight? His watts/lb would certainly increase without any more training! But did he feel that was a reasonable target for him?
NOTE: I do want to clarify that we used the Keiser bikes. Wattage cannot be compared to a power meter such as a Power Tap. If Stirling gets a power meter for his bike outside (which he is considering) he can still train using his new HR zones based on this test, but cannot use the power zones associated with these Keiser bikes.
If all goes well, this facility will have new bikes next year with power meters that measure actual power, not estimated. Then I’ll REALLY be able to make some assumptions.