
After showing some instructors how to analyze a power training file, they were absolutely amazed at how much they learned. While they understood in theory, until they saw it visually they hadn’t realized how apparent it would be that changes in cadence could affect heart rate. When they saw the delayed response in heart rate to a hard effort, both on the way up and the way down, compared to the immediate response of power, one of them said to me, “Oh, so THAT’S what you mean when you say power is immediate, heart rate isn’t! I can see how that can affect how you coach heart rate!”
In that moment I realized that learning how to read and interpret a workout file (both with and without power) could really help instructors. It would be an amazing tool to aid in putting together profiles since you will better understand the possible impact your choices (cadence, resistance, power, etc.) will have on your riders. By looking at a file from a less fit rider who suffered in the class or was unable to do the prescribed workout, you will understand why some might struggle with your coaching. Or, maybe you might discover that some things you are doing might not be as effective as you thought.
So, I have decided to add a new educational series to what we offer at the Indoor Cycling Association. We will teach you how to analyze a workout file and give you many opportunities to practice. I believe this could very well be one of the most helpful tools you may ever experience on your path to becoming a better indoor cycling instructor and coach.
This first one will be for free, for all instructors. (All future ones will be for ICA members only.)
We have several excellent coaches amongst our ICA contributors, so these workout analyses won’t just be from me—you’ll get a variety from different sources.
When it’s first posted, we will present the file with only minimal information and a few hints. The goal is to have you practice. You can study the file, then leave a comment about what kind of profile you think it is. Ask yourself what are the responses (heart rate, power) to changes in cadence, to intensity, to duration. Or, perhaps you might notice power dropping over successive intervals—explain why you think that might be happening.
One week later, we will respond to the guesses about the profile and answer any questions. An annotated version will be added with our analysis (like the ones below), where we will point out things you might have missed.
“But I don’t have power—will this help me?”
ABSOLUTELY! Whether you have a device to measure it or not, you are still producing power, so when you understand that wattage is the effort and that heart rate is the response to that effort, your future profiles may never be the same…they will be much better!
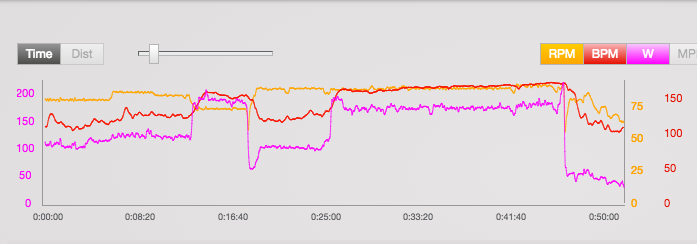
In the files below, the yellow is cadence (RPM), visible on the right axis. The red is heart rate (BPM), also on the right axis. The pink is power (W, for watts) on the left axis. (Tip: Use a straight edge to line up with the corresponding axis to estimate the rpm, bpm, or wattage.)
This is my own file, done on my bike at home (not while teaching). My years of riding experience makes this one is easy to analyze, but future examples may be from beginners or someone struggling to get through an interval or who may not be good at holding cadence constant. In the image below, you can see by the fairly level yellow line that I am able to maintain a consistent cadence, for example. In a future post, I will show you files from riders doing their first field tests, so you can see the difference. It will also be very helpful to see how someone improves over time.
Power File Analysis #1: FTP Field Test
Look at the file below. Can you tell that it is a 20-minute field test? Before you look at the annotated analysis, examine the three metrics closely and see if you can see a relationship. What causes the changes (i.e., rise or fall of heart rate or of power)? What do you think precipitates what?
Step 1 of the Analysis
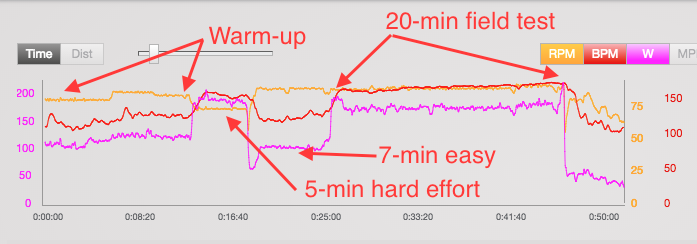
Identify the phases of the class. Below, you can see a warm-up of about 12 minutes, a 5-minute hard effort, followed by a 7-minute easier segment. Then comes a 20-minute consistent effort (which is how you can guess that it is a field test), followed by the cool-down.
In the warm-up, notice the heart rate (red). After the first few pedal strokes, my initially elevated heart rate subsided. This is because I relaxed and settled into the easy effort. Over the next 12 minutes, you can see how the power rises gradually as I added small increments of resistance, bringing the heart rate up gradually as well. That’s how it should be!
You can see a slight increase in the cadence halfway through the warm-up. This is because I had a song that was a little bit faster (I use the beat of my music to help guide cadence). This probably helped raise my heart rate a bit more (see the small red spike). A third song was a few bpm slower, which you can also detect. Cadence was in the low to mid 80s for the warm-up.
In the 5-minute hard effort, note how power increased immediately, but the heart rate takes time—about 30-40 seconds. This has huge implications for those who coach solely by heart rate. What might they be?
In the 5-minute effort, I stood up, which required more resistance (and a concomitant increase in power). When I sat back down, I had to reduce the resistance/power a bit, or I wouldn’t have been able to hold it.
During this hard effort, can you see that cadence is lower? What does this tell you? It means a bigger gear (or “climb”) right around 70 rpm; I loaded on the resistance to help bring up the power output. If you’ve used the ICA field test (FTP or LTHR), you know how crucial this 5-minute hard effort before the 20-minute effort is.
At the end of the 5-minute hard effort, can you see a large drop in power, followed by an uptick? This is common. Many people sweep the resistance knob all the way to the left after pushing hard; often they take off too much. I realized quickly I took too much off (my power had dropped to about 50 watts), so I added some back on. After that, the easy recovery segment was smooth, at about 90 rpm. You can see how heart rate took a little bit to drop.
Let’s look at the field test up close…
Step 2: The Field Test
#1. When I do a field test in which we are also taking the average heart rate (to estimate lactate threshold heart rate), I actually go for 21 minutes and press the START button after one minute. Why? Because otherwise, that lag in heart rate response would be part of the average calculation. I want to get the average after it’s risen. For wattage, it’s not as necessary because power increases the millisecond you step on the pedal with heavier resistance.
Speaking of power, you can also see at this point how I had to drop my wattage back a little—I realized I couldn’t maintain that for 20 minutes. Since I’ve done this many times, it’s not that big of a wattage swing. But with riders new to field tests, you are likely to see really large swings. This is something that improves over time.
My cadence is a solid 88–90 rpm most of the way. Can you also see that cadence was about the same for the preceding recovery—same cadence but wattage was about 60 watts lower? What went on here? (hint: resistance)! This is revelatory for those who think higher cadence must mean higher intensity.
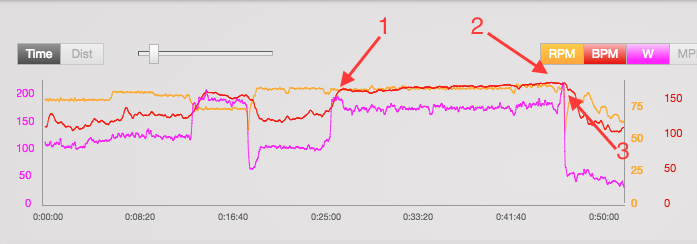
#2. Look at the red line. Even though power is pretty stable most of the way (except for start and finish), can you detect a slight increase in heart rate? This is something called cardiac drift which I explain here. In that explanation, you’ll see why I caution instructors who are asking riders to keep a constant heart rate in an endurance class (for example, 75% of maximum heart rate). Due to cardiac drift, their power output is likely dropping, so you are actually detraining them if you hold heart rate constant over an extended period.
#3. This last spike is from a desire to squeeze as much out as I can in the last 20 seconds. (Note, however, that it doesn’t cause a heart rate spike.) Just after this, I shut it down. Power drops immediately, and I slow my cadence. Notice how long it takes heart rate to fall in comparison.
What did you learn?
Did this help you understand how cadence, power, and heart rate are related to each other? By looking at the power output at a certain cadence, can you see how you can make assumptions about how much resistance is on?
Can you see how analyzing different types of classes, and comparing files of different levels of riders for the same workout can vastly improve your own coaching while helping you put together more meaningful profiles of your own?
If you are not yet an ICA member, I hope you’ll consider joining. This is only a tiny fraction of what you’ll learn. Our mission is to help you be better at what you do, so you can fill your classes and change even more lives! Knowledge is power…(pun intended!).
Note: Future workout files may come from different software. The one above is from TrainingPeaks, but they may be from TrainerRoad, or other apps that record cadence, heart rate, power, and more.
Very good article. If indoor cycling certs were legit, the written exam would include interpretation of these types of charts. In my opinion, this should taught at all instructor trainings and should be be a skill required to be certified.